Tuesday, August 31, 2010

How to publish your Windows Azure application right from Visual Studio 2010

Windows Azure is an emerging technology that will be gaining bigger share of our life as software developers or IT Pros. Using earlier releases of Windows Azure Tools for Visual Studio there was an almost painful process of deploying application into the Azure environment. The standard Publish process was creating Azure package and opens the Windows Azure portal for us to publish our package manually. This option still exists in Visual Studio 2010, and is the only option in Visual Studio 2008. However, there is a new, slick option that allows us to publish / deploy our azure package right from within Visual Studio. This post is around that particular option.

Before we begin, let’s make sure we have installed the most recent version of Windows Azure Tools for Visual Studio.

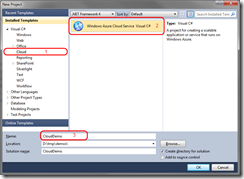
For the purpose of the demo I will create very simple CloudDemo application. Just select “File” –> “New” –> “Project”, and then choose “Cloud” from “Installed Templates”. The only available template is “Windows Azure Cloud Service C#”:

01_NewProject

A new window will pop up, which is a wizard for initial configuring Roles for our service. Just add one ASP.NET Web Role:

02_addWebRole

Assuming this is our cloud project we want to deploy, let’s first pass the Windows Azure Web Role deployment checklist, before we continue (it is a common mistake to miss configuring of DiagnosticsConnectionString setting of our WebRole).

Now is time to publish our Windows Azure service with that single ASP.NET WebRole. There is initial configuration, that must be performed once. Then every time we go to publish a new version, it will be just a single click away!

Right click on the Windows Azure Service project from our solution and choose “Publish” from the context menu:

03_publishMenu

This will popup a new window, that will help publish our project:

04_publish_mainScreen

There are two options to choose from: Create Service Package Only and Deploy your Cloud Service to Windows Azure. We are interested in the second one – Deploy your Cloud Service to Windows Azure. Now we have to configure our credentials for deploying onto Windows Azure. The deployment process uses the Windows Azure managed API that works with client certificate authentication, and there is a neat option for generating client certificates for use with Windows Azure. From that window that is still open (Publish Cloud Service) open the drop down, which is right below “Credentials” and choose “Add …”:

05_publish_mainScreen_addCredential

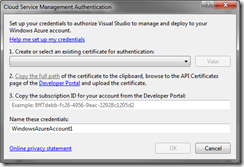
Another window “Cloud Service Management Authentication” will open:

06_publish_addCredentialWindow

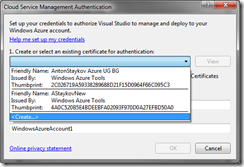
Within this window we will have to Create a certificate for authentication. Open the drop down and choose “<Create…>”:

07_publish_addCredentialWindowCreate

This option will automatically create certificate for us (we have to name it). Once the certificate is created, we select it from the drop down menu and proceed to step (2) of the wizard, which is uploading our certificate to the Windows Azure Portal. For this task, the wizard offers us an easy way of doing this by copying the certificate to a temp folder. By clicking on the “Copy the full path” link it (the full path) is automatically copied onto our clipboard:

08_publish_addCredentialAlmostFinal

Now we have to log-in to the Windows Azure portal (http://windows.azure.com/) (but don’t close any Visual Studio 2010 Window, as we will be coming back to it) and upload certificate to the appropriate project. First we must the project for which we will assign the certificate:

09_AzurePortal_SelectProject

Then we click on the “Account” tab and navigate to the “Manage my API certificates” link:

10_AzurePortal_Account

Here, we simply click browse and just paste the copied path to the certificate, then click Upload:

11_AzurePortal_UploadCertificate

Please note, that there is a small chance of encountering an error of type “The certificate is not yet valid” during the upload process. If it happens you have wait for a minute or two and try to upload it again. The reason for this error is that your computer time might not me as accurate and synchronized, as Windows Azure server’s. Thus, your clock may be a minute or more ahead of actual time and your generated certificate is valid from point of time, which has not yet occurred on Windows Azure servers. When you upload the certificate you will see it in the list of installed certificates:

13_AzurePortal_UploadedCertificate

After you upload the certificate successfully to the Windows Azure server, you have to go back to the “Account” tab and copy the Subscription ID to your clipboard:

12_AzurePortal_SubscibtinId

Going back to Visual Studio’s “Cloud Service Management Authentication” window, you have to paste your subscription ID onto the field for it:

14_publish_CloseToOK

At the last step of configuring our account, we have to define a meaningful name for it, so when we see in the drop down list of installed Credentials, we will know what service is this account for. For this project I chose the name “WindowsAzureCloudDemoCert”. When we are ready and hit OK button, we will go back to the “Publish Cloud Service” window, we will select “WindowsAzureCloudDemoCert” from Credentials drop down. An authentication attempt will be made to the Azure service to validate Credentials. If everything is fine we will see details for our account, such as Account name, Slots for deployment (production & stating), Storage accounts associated with that service account:

 15_publish_OK

When you hit OK a publish process will start. A successfull publish process finishes for about 10 minutes. A friendly window within Visual Studio “Windows Azure Activity Log” will show the process steps and history:

16_published

Well, as I said there is initial process of configuring credentials. Once you set up everything all right, the publish process will be just choosing the credentials and Hosted Service Slot for deployment (production or staging).

Have a great time developing for Windows Azure!
Tuesday, August 24, 2010

How to debug your application (http protocol) using Fiddler

Fiddler has been out there for a while, but recently I discovered that it is either unknown, or not used, so I decided to write a short post on what it is, and how we can easily debug HTTP traffic (for example WCF Service calls) using it.

Before diving into essentials I would like to mention what it is. Fiddler is a debugging HTTP proxy(you can read more on what proxy server is here). Being so, when started it automatically configures user’s system to use it.

So, here is a “Welcome” screen of Fiddler:

fiddler_01_main

Where, you can see a Web Sessions list (1), Working area (2,3) which is split over Action tabs (2) and Information window part (3). From the Action tabs, you would spent most of the time inside “Inspectors” while you debug your http traffic.

Once you download, install and run it, you can check the Internet Connection settings, and you will notice that it has automatically configured the system to use a HTTP Proxy on address 127.0.0.1 (which is local machine) and port 8888:

fiddler_02_connections

Please note, that although the shortest way to go to “Internet options” if from the “Tools” –> “Options” menu from Internet Explorer, these options are not just “Internet Explorer Options”. These are system-wide internet connectivity options, and all windows based programs are reading them. So when this proxy is set, any program that relies on windows settings (and not its own settings) will use that proxy for HTTP connections.

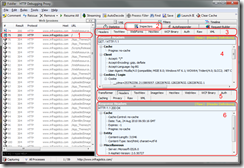
So let’s see how to inspect a single HTTP request. Just install and run Fiddler. You can run fiddler either from Windows’ Start Menu, or from Internet Explorer’s “Tools” menu. Once you run it, just leave it open and navigate to a website of your choice. You will be surprised how many HTTP requests are issued for a single web page to load. Every single image you see, every single style loaded, every JavaScript load initiates a HTTP request. So pick up one of the requests (preferable some of the first requests, that will load the HTML) and go to Inspectors from Action tabs:

fiddler_03_inspectors

So, you see the selected web session (1), and you click on Inspectors (2). Well, the Inspectors information area is split horizontally on two parts. First part (3,4) is inspecting HTTP request issued by the client application, while the second (bottom) part (5,6) is inspecting the server response. On the image 3 and 5 are the different types of inspectors, while 4 & 6 are the information parts that shows information structured by the way of showing it (using 3 & 5). You will easily see that you can inspect the request by viewing it in:

  • Headers – showing only headers
  • TextView – showing plain text view of the request
  • WebForms – showing only variable names & values sent with the request (if you have some forms submitting some data)
  • HexView – shows hexadecimal representation of the request
  • Auth – showing just the Authentication headers (if present), so you can inspect issues with authentication
  • Raw – showing the Raw HTTP request (headers + body as sent by the client application)
  • XML – showing the request in XML tree navigation structure. It is very useful for visualizing XML RPC communication or SOAP communication, as it displays the XML in tree structure.

For the Response part of the screen you will see 3 additional types of displaying information:

  • Transformer – showing general information on the response, as well as response size
  • Caching – showing whether the response sent is cached
  • Privacy – showing any information, if present, regarding PGP privacy
  • Image View – showing the actual image, if the request was returning image

During development process we are more likely to run your application at “localhost”. What is localhost? Long explanation you can find here: http://en.wikipedia.org/wiki/Localhost. In basics, this your computer. And localhost is always resolved as IPv4 address 127.0.0.1 or IPv6 address ::1. Here comes the tricky part. You can read the FAQ Section on Debugging localhost. As explained, if your application launches on http://localhost:45960/WebSite1/Default.aspx, you can change the “localhost” to “ipv4.fiddler” (http://ipv4.fiddler:45960/WebSite1/Default.aspx) and you will see the same page, but the traffic will go through fiddler.

The issue comes from the way localhost is interpreted by applications. Although a system proxy is configured, the applications (especially .NET based) automatically bypass proxy for this address. And you have no means (in .NET) to instruct application to use proxy server when connecting to localhost. So you have to use any other name to access your application. The tricky moment is that Cassini Web Server (Visual Studio development server) binds only to IPv4 address of 127.0.0.1. And you must somehow add another hostname that resolves to 127.0.0.1. The easiest, the smoothest way to do that without writing any code, without altering any configuration setting of your project, without changing the registry, is relying on the way windows DNS resolver works. On every windows machine (well at least since Windows XP & 2000 and later) there is one single plain text file, located on same place on all windows platforms (x86, x64) regardless of windows version:

fiddler_04_hosts

c:\windows\system32\drivers\etc\hosts

It is a file without extension. In more recent versions of windows you have to be administrator (run notepad as administrator) in order to save changes to that file. It is very simple and its first lines are following:

# Copyright (c) 1993-2009 Microsoft Corp.
#
# This is a sample HOSTS file used by Microsoft TCP/IP for Windows.
#
# This file contains the mappings of IP addresses to host names. Each
# entry should be kept on an individual line. The IP address should
# be placed in the first column followed by the corresponding host name.
# The IP address and the host name should be separated by at least one
# space.
#
# Additionally, comments (such as these) may be inserted on individual
# lines or following the machine name denoted by a '#' symbol.
#
# For example:
#
#      102.54.94.97     rhino.acme.com          # source server
#       38.25.63.10     x.acme.com              # x client host

# localhost name resolution is handled within DNS itself.
#    127.0.0.1       localhost
#    ::1             localhost

I open that file, and add a single line at the bottom:

127.0.0.1 developdemo

Now I know that whenever I type http://developdemo/ I will open the localhost (127.0.0.1). And whatever windows application makes a HTTP request to “developdemo” – it will be requesting information from localhost. And if Fiddler is running, it will log all and any HTTP requests that are going to and from developdemo host.

Well, I gave you the basics, and I hope that you now know that there is a way to debug your HTTP based application.