So you wanted to get your hands on Windows Azure and downloaded all the tools/sdk, walked though some web casts, blog posts and create your first Cloud Service project with a single Web Role. Now you notice that it runs mostly on port 81, but sometimes on 82 and wonder why. Here is the answer.
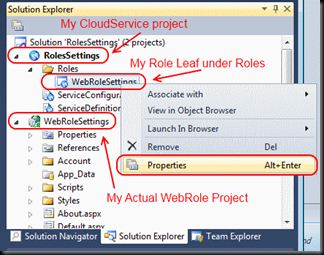
By default, when you add a WebRole to your Cloud Service project an HttpIn Input endpoint is automatically assigned to it and bound to port 80. The InputEndpoints for a Role in Windows Azure are defined in the ServiceDefinition.csdef file. But you can easily see and manipulate them via a nice UI. To check and manipulated all settings for a Role just right click on the Role leaf under Roles folder in your CloudService project, and select Properties:

From there, you can change your Endpoints:

As you can see, you can change your endpoints right from this User Interface properties window. You can also change a lot of other stuff here.
Here is when you have to start being careful and know exactly what you are doing! The Endpoints defined here are the endpoints which will be used when you deploy your Cloud Service to the Cloud! If you change the port here, either accidentally or intentionally, the new port will be used, and your web application will not be accessible on port 80 anymore! Be aware of that!
But why the port is not 80 when I run locally? Why my application runs on port 81 or even 82?
There is only one simple answer to that question: your port 80 is already bound to other application when your package is deployed to the development fabric. When you hit F5 (or Ctrl+F5) to run your project locally, a local Development Fabric is started, your cloud service application is packed into a deployment package and deployed to the Development Fabric. The Development Fabric then looks into its definition and searches for required endpoints. It finds out that your service requires port 80 as an Endpoint. Development fabric tries to bind to port 80 on localhost (127.0.0.1). It always binds to 127.0.0.1 IPv4 address. If port 80 is already occupied, instead of throwing an error and making our life harder, it just tries next port (81). If next port is also occupied, Dev Fabric tries next one (82) and so on until a free port is found. Please be aware, that this only happens on Local Development Fabric. This process will never happen on Live windows Azure Environment (either staging or production)!
What is the reason for my port 80 being occupied?
Here are some:
Applications that most often occupy port 80 are, but not limited to:
- IIS (Is there a Microsoft Web Developer who hasn’t enabled IIS on development machine?)
- Skype. Yes Skype! (Tools -> Options -> Advanced -> Connection: [] User port 80 and 443 as alternative for incoming connections). This option is enabled by default. And if you happen to be running Skype before starting IIS for example, your IIS will not be able to bind to port 80 and you might wonder why. Development fabric however, just searches for next available port and binds to it.
- Apache Web Server
- Any other Web server
Why sometimes development fabric binds to next-next available port? Why it binds to 82, while there is no application bound to 81?
Sometime, the cycle between destroying a deployment and creating next one is too short, and port 81 (for example) is still occupied by a deployment still in destroying stage. While the next deployment is searching for a port to bind to. That's why 82 is taken.
Another issue might be that a connection to that port sill exists. Connection state might be CLOSE_WAIT, but that also does not allow binding to the port. You can see a list of all connections with their statuses with the following command:
netstat –an
Everything said so far is 100% valid for a Worker Role. Let’s say you have a worker role, which exposes an IP Endpoint and implements custom TCP Server. You have on-premise application which uses custom TCP based protocol, and you have developed your custom TCP server to run in the cloud. Then you exposed the endpoint for this custom TCP server. When deployed to Windows Azure, your endpoints will be exactly same as defined in your service definition. However when running locally your endpoints might be different. You should expect this behavior, and if this is unwanted, always check out the network connections with the “netstat” command or Sysinternals TcpView.
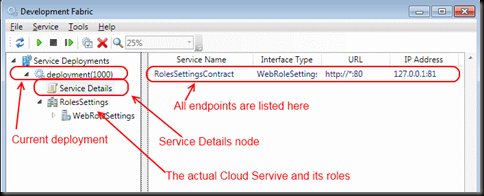
You can also check the current active endpoints for your development fabric deployment. Just right click on the Azure windows icon in the system tray and select “Show Development Fabric UI”. Then navigate to your deployment and select Service Details Node:


